Tip: Read the explainer guide on SEO Core Web Vitals.
Are you tired of staring at your website's performance scores and feeling like you're stuck in a rut? You're not alone. It can be frustrating to try different suggestions for improving performance, only to see little or no improvement. But what if I told you that there's a way to automate the process of applying performance optimization suggestions and see which ones actually have an impact on your score? In this blog post, we'll share the results of our testing and show you how you can use tools like WebPageTest and Performance insights to streamline the optimization process and take your website's performance to the next level.
Both tools have an approach to experiment with how certain actions can improve performance scores. For example, WebPageTest has an “Opportunities & Experiments” tab:
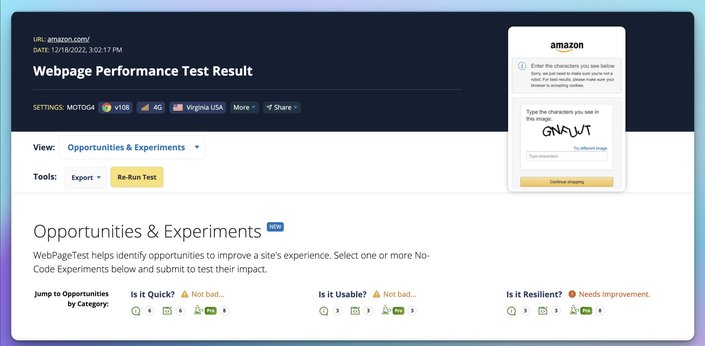
On the bottom you have the experiments:

In the experiments section, you can make modifications to different parts of your test:
- Adding HTML to the document: for example, adding HTML to the start or end of
<head>or alternatively adding HTML to the end of the<body>tag. This could be used for testing a JavaScript<script>tag in different places and seeing how it affects performance. - Replacing text: for example, changing headings to see if it affects LCP.
- Delivery optimizations: Defer Render-Blocking Scripts, Async Blocking Scripts, Load CSS Async, Add Image Aspect Ratio, etc., etc… (*caveat - you have to pay to run most experiments)
Number 3 has the bulk and most if not all of the things that really have any effect on Google Lighthouse scores, which is what then becomes real user data that is gathered for the Google Chrome User Experience Report.
I’m sorry...that was boring.
That is what happens when tools like GPT3 and AI get into the mix.
It’s never been easier to make a machine spit out words.
What it lacks is human creativity.
I’m gonna stop regurgitating what every other post says about web performance and save us time by keeping things simple, short, conversational, perhaps unorthodox, human if you will, and hopefully entertaining.
Including the writing.
Think of this as an experiment, and you’re a part of it (LMK if you liked it or not).
Those scores? Lighthouse scores? they are also what determines a website’s visibility in search and the bottom line for a business.
- When your CWV scores are 📈
- 💰💰💰💰💰💰💰💰💰💰💰💰💰💰
Thus:
- Performance 📉
- 💸 (bye-bye)
So, as developers, we want to achieve good performance for the apps we’re working on so that the business we work for will succeed and we will have a place that pays us to write code (or about code in some cases 😂).
(gotta work somewhere… or for yourself - yeah, yeah, yeah, y’all “WANTtrepreneurs” - did you ever try to do it yourself?! That s**t is hard!!! Sorry, I’ll get ahold of myself, cough. cough.)
..And we’re trying to help all of our customers succeed, and the developer community in general succeed.
That’s why we’ve made:
- Partytown (open source) for 3rd party code
- Qwik (open source) for 1st party code
- Visual CMS (the product that I am not linking to because that would be too promotional) for 1st party content
What the above help with is making things easier, mostly in terms of performance for websites. And of course, to make money 🤑.
What? I just explained why.
Where was I…
Oh, helping with performance.
To do so, we need to measure.
Like I’ve said, Google already tells us! Core Web Vitals.
How do we measure it?
Tools, Like WebPageTest, Your browser, etc.
Some tools help automate some of the tedious work of running those tests.
There are probably others I’m forgetting that I will probably be reminded of in countless posts or tweets or whatnot either contradicting what I say or “you didn’t mention blah blah blah…”
Anyway, so WPT tool does a great job at running multiple tests instead of you needing to run Lighthouse through dev tools 100 times and waste your time because your browser keeps crashing from all those extensions you got running that hog up your browser’s main thread anyways, all to help automate all those clicks you need to do just to run those tests because you’re a developer and you wasted 6 hours writing that PlayWright script, just because you wanted to try a new piece of tech...
I’m out of breath…
I can’t keep apologizing, so I’ll just keep going — gotta ship this before the new year!
Nothing against WPT folks, they’re awesome and doing awesome work, and they need to get paid, like everyone, and that’s why they made the “experiments tab”.
So, like I was saying, they do all the hoojmajaja that tries the different ways to optimize a web page.
Those are all of those hidden/not hidden edges of MDN that you never got to or cared enough to read. All that hog podge about minifying code, serving images in the right format yada yada yada…
Enter Performance insights, the same idea just grouped a bit differently, and automatically runs experiments, then shows scores for all the scenarios.
The three most impactful areas for improving performance scores are:
- Images
- CSS
- JavaScript
Like, my buddy, Steve said (in his gen-z short from video that I might share with you if you actually read through 😜) if you do just 3 things, you can get a 95-100 score on LH, as well as have roughly a 2 second Time To Interaction. And as we know:
Here’s the file with numbers and graphs and s**t.
In the above list, we ran the Performance Insight tool on 50 of the most popular eCommerce sites.
Of course, no need to mention, actually, probably better that I do:
All measurements in the file are correct for the time of running the tests and may vary if you test now.
So these are the average scores, and you guessed it, red is 👎🏽, yellow 😑 , and green 👍🏽.

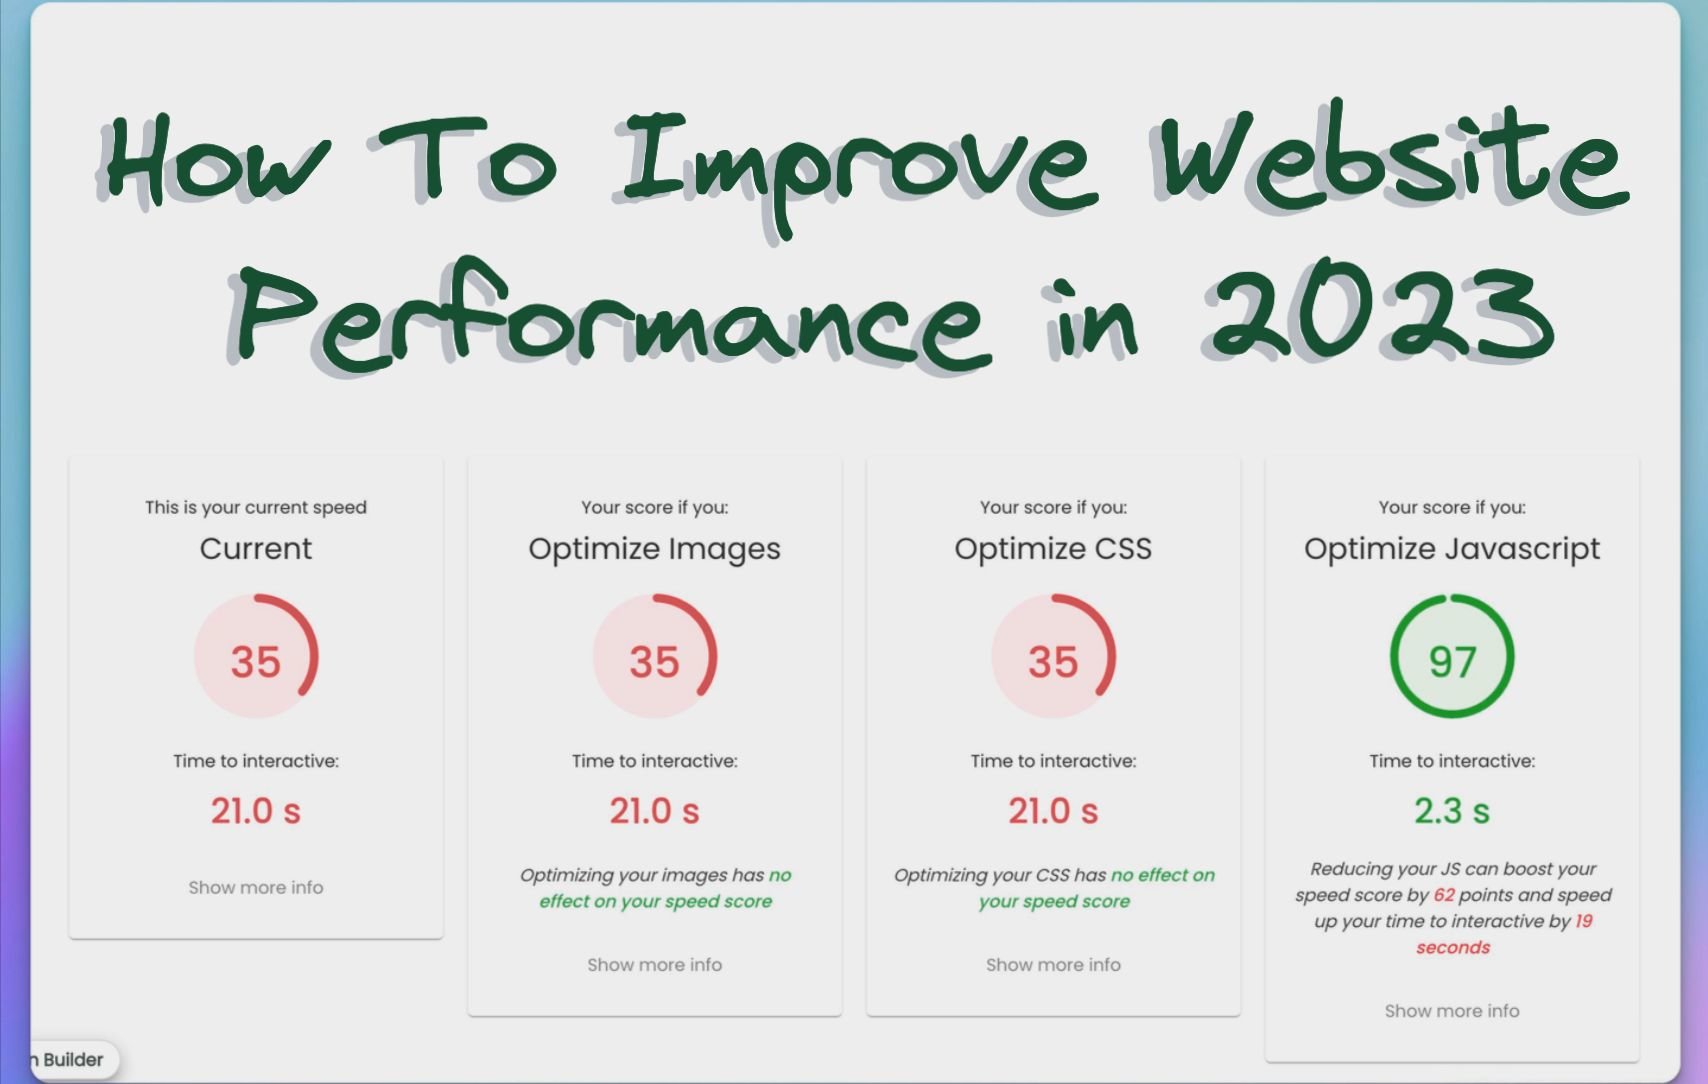
Here’s one example where you can see that optimizing images and CSS does nothing to improve the score.
That’s probably because those top 50 sites pay the good 💲 to top talent devs, and they already picked up that low-hanging fruit.
On the other hand, optimizing JavaScript will make the site go VROOOOOOM! 🏎️
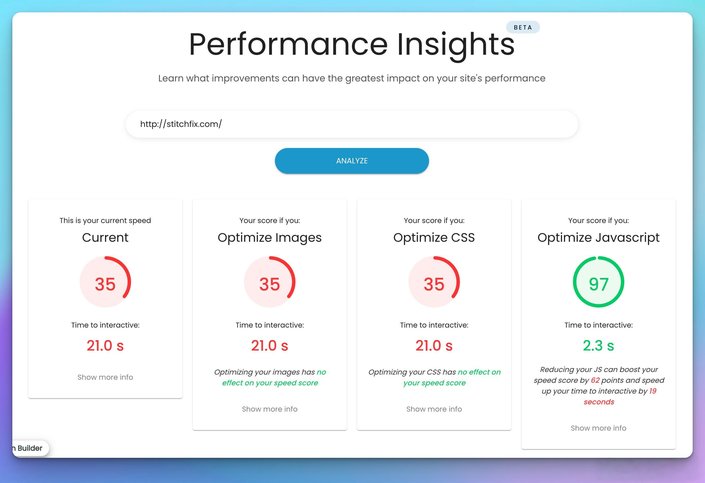
Images are basically a solved problem by most frameworks with a bespoke <Image /> component for each, and by using providers such as Cloudinary and the like.
For CSS, a lot of solutions can suffice, such as Tailwind, CSS Modules, etc. But be wary of CSS in JS solutions like Emotion and Styled Components.
All right, you can see the image (or read the descriptive and accessible alt text 😅).
I know you can see where the green is at.
JavaScript is the language everyone loves to hate. That is the main monkey wrench that’s stuck in our wheels. It’s too bad that it’s what’s easiest for a developer to add, and the fastest way to f**k up your performance.
“…shipping too much of JavaScript means you will be creating user experiences that are slow to load, sluggish to respond, and frustrating to users.” —HTTP Archive’s Web Almanac
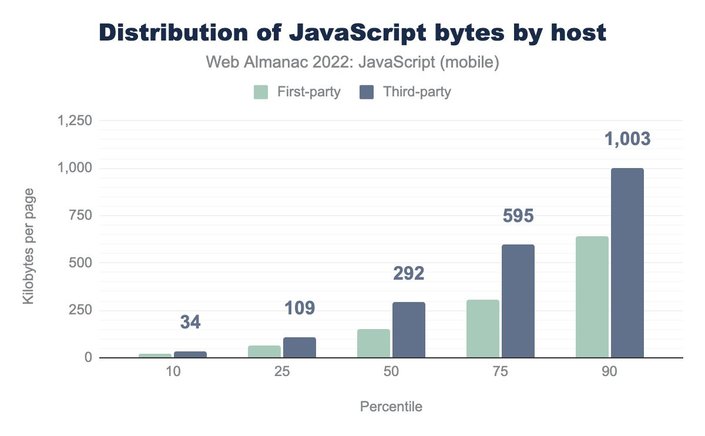
And yet, we’re addicted to JavaScript. We ship a s**tload of it as you can see in The Web Almanac:
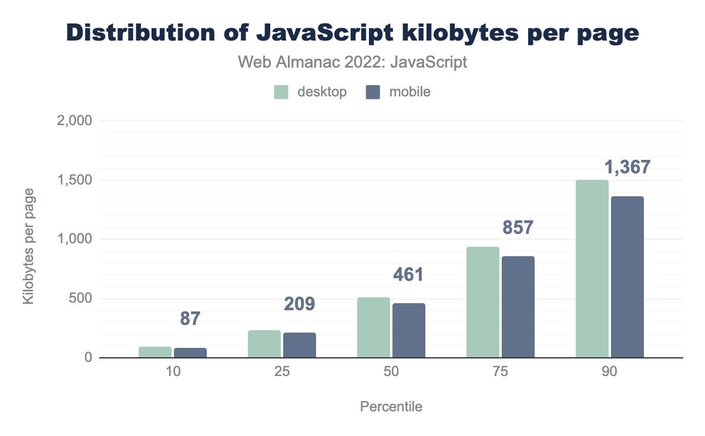
If we shipped no JS, our Lighthouse scores would go to the moon! 🚀
The number of bytes in the 90th percentile is 🤯. And these numbers are rising every freaking year.
Yet there are things we can do to minimize the amount of JS we ship and to improve JS load time, but the fact of the matter is that most websites don’t bother.
For example, a small thing is not putting script tags in the <head> tag, cuz that’ll block your rendering, and still, 77% of websites make that mistake.
We also seem not to care who we bring inside our house and that they came in with mud, 💩, and cookies.
The number of third party scripts on web pages is staggering! Seems like marketing and product folks don’t tell devs how many things they stick into GTM. Have a look:
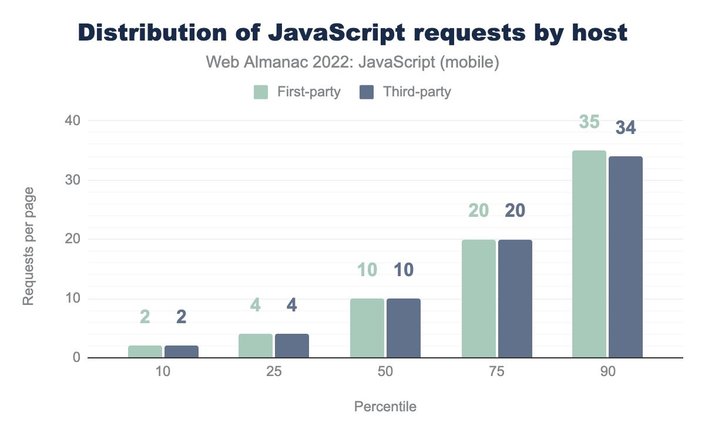
And can you guess how much third-party code is compared to first-party code?
I can’t even find the right words to express how absurd these numbers are:
The thing that can rein in your data-mongering product managers and marketing managers is Partytown.
It puts those scripts in the corner to wait and cry like an annoying little child that keeps disrupting class. Technically, it puts them in a web worker and takes them off the main thread, so maybe it’s not putting them in a corner, but moving them to a different classroom for a while until they relax.
Let’s face it, we still need to write JavaScript.
How else would we do that super unnecessary animation that collapses a 3d rendered header that is hooked up to your scroll position and at 50% scroll height opens up the newsletter popup?
We need interactions. Users want them, and we like to build them.
So for:
- More Interactions 📈
- Less JS 📉
Try:
The bottom line
Improving performance is hard.
Each layer of the holy trinity (HTML/CSS/JS) has tons of nuances.
JavaScript is what you should focus on if you want the biggest bang for your buck.
Do your research. Measure. Try different things and measure again.
Got it?
Bet.
Play around with dem tools, they dope, no cap.
Hope this hits different 🙂
Oh yeah, here’s that TikTok link.
Builder.io visually edits code, uses your design system, and sends pull requests.
Builder.io visually edits code, uses your design system, and sends pull requests.


 Connect a Repo


